Consistency of bad news but the strength of markets
Ever since I started at Standard Life in 2015, there has been relentless news which you could quite easily link to an impending market crash. The lead up to Brexit referendum, and the following result, the 2016 of Donald Trump, the US-China Trade Wars in 2018, Coronavirus from March 2020, supply chain issues post-Coronavirus, the invasion of Ukraine by Russia in 2022 causing energy price shocks, and now the behaviour of the Trump administration in its second term particularly with regards to trade.
And yet, despite this volatility and at-times cataclysmic news headlines markets are able to make money, and those who remain invested have been rewarded. A global portfolio in the last decade returned an avergae 8.7% a year, the equivalent of £100,000 becoming £231,500 in 10 years.[1]
Yes, a short-term swing can cause discomfort, but Wealth Spring’s clients are invested for the long-term with an acceptance that we cannot control how markets behave. Timing the market doesn’t work and trying to assess which region of the globe is going to drive returns is already done for us by the allocation of money to listed companies across the world.
Wealth Spring’s portfolios
Wealth Spring’s goal is to capture global returns, control our costs, and not react to short-term changes. We let client lives, and the needs of their financial plan drive decision-making. We then assess contribution rates, risk and return profiles, withdrawal rates and timeframes rather than react to market events.
However, Wealth Spring’s portfolios don’t purely follow a passive profile. The active element is a longer-term conscious decision based on the decades of evidence that supports leaning an investment portfolio towards ‘value’ and ‘small’ companies, definitions below. These elements have been found to outperform the broader market over ten year rolling periods since 1939.[2]
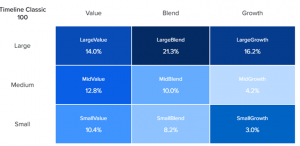
Below is a comparison between Wealth Spring’s client portfolios and a comparable market tracker. For the ‘equity’ portion of a portfolio, the percentages below demonstrate the portions held in ‘value’ or ‘growth’ and ‘small’ or ‘large’ companies, then there are stages in-between these two called ‘blend’ and ‘mid’.
The first chart, Timeline Classic 100, represents the portfolio spread accessed by Wealth Spring clients in the ‘equity’ portion of their portfolio. And the next chart, Timeline Tracker 100, represents the portfolio spread in the equity portion of a market-led portfolio, without tilts to ‘small’ and ‘value’. This concept applies to both the conventional and ESG versions of Wealth Spring’s portfolios. The conventional portfolio has been captured below.

![]()
By leaning a portfolio to ‘value’ and ‘small’ Wealth Spring’s client portfolios are tilted away from the concentration in the top tech stocks, which have experienced the sharp end of volatility over the recent news cycle.
Disclaimers
*Each client portfolio will have different proportions of equities and bonds, depending on their agreed risk profile. The equities element and the proportion of small and value has been compared above.
*Investments carry risk. The value of your investment (and any income from them) can go down as well as up and you may not get back the full amount you invested. Past performance is not a reliable indicator of future performance. Investments should be considered over the longer term and should fit in with your overall attitude to risk and financial circumstances.
*A company defined as ‘value’ has a low price as compared to its fundamental value, which is captured by earnings to price ratio, book to price ratio and its earnings.
*A company defined as ‘small’ is purely defined based on its market capitalisation, the value of total shares traded in the company. For Wealth Spring’s portfolio, the average market
[1] FTSE All Cap Index
[2] Timeline Factor Investing Guide
[3] Vanguard Global Small Cap Portfolio Data.
[4] Timeline Technical Portfolio Analysis
Get in touch
We’d love to hear from you.
By contacting Wealth Spring you confirm you have read our privacy notice, which can be found here.

